Package of 'sstools'
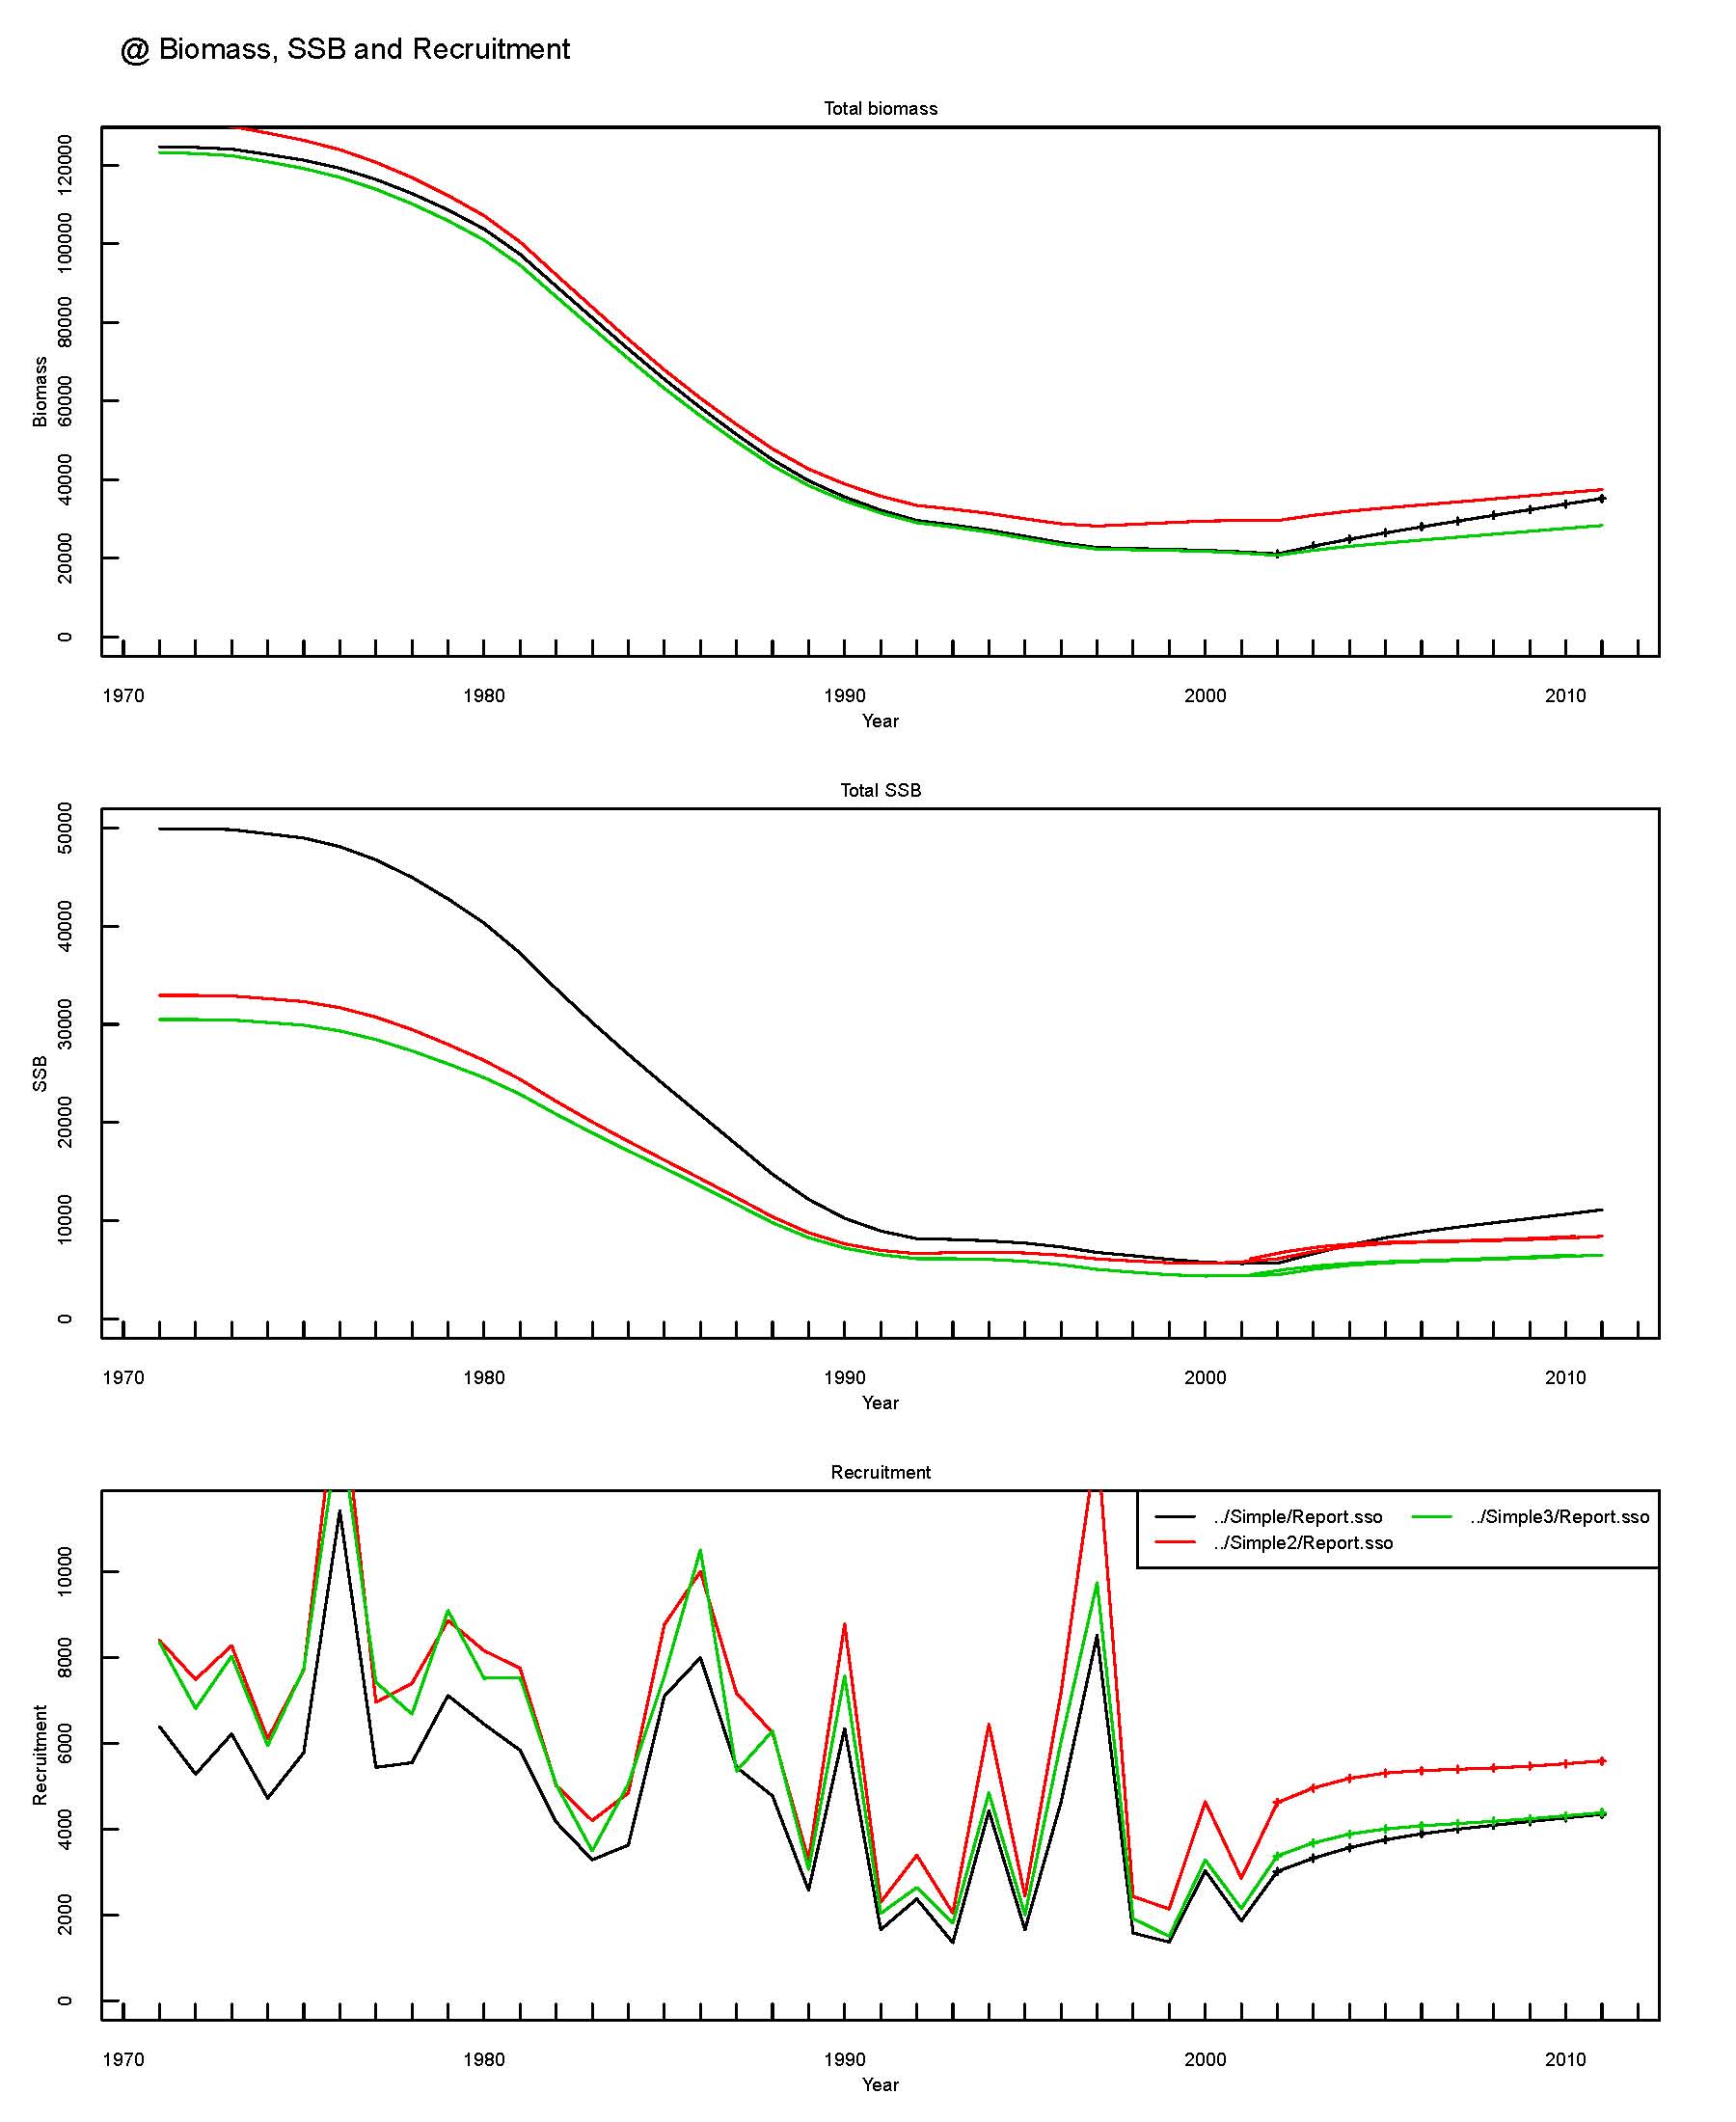
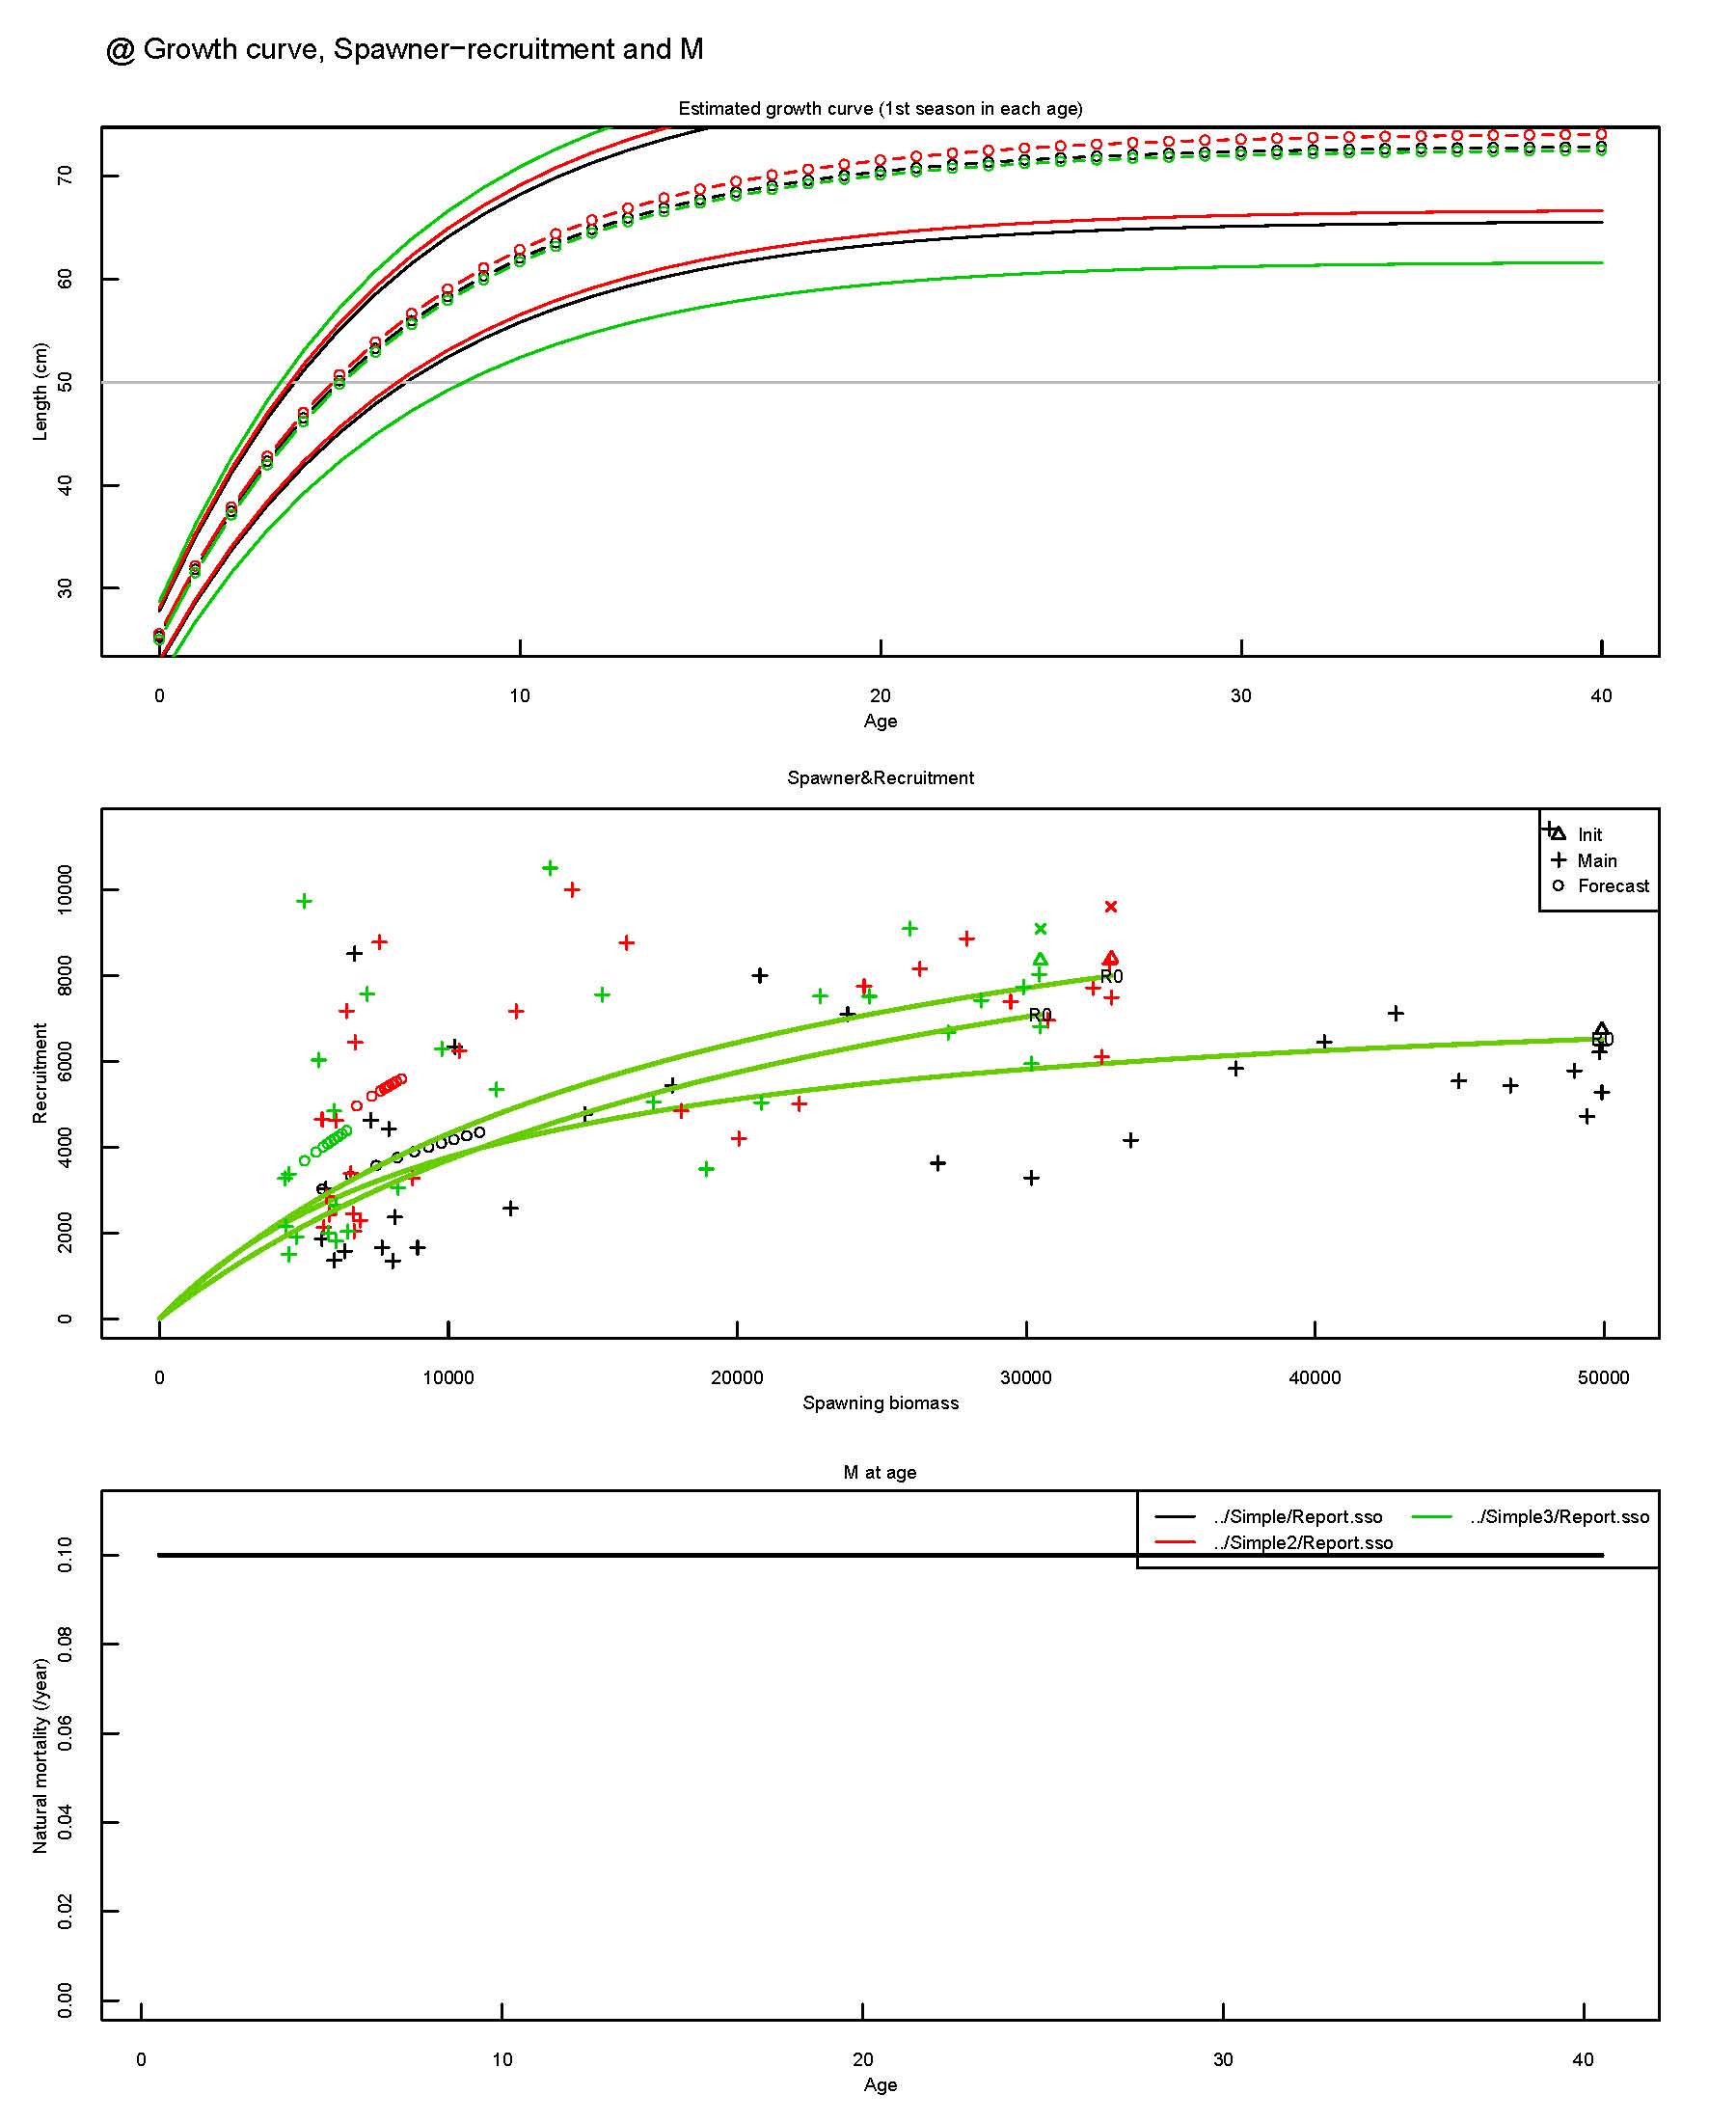
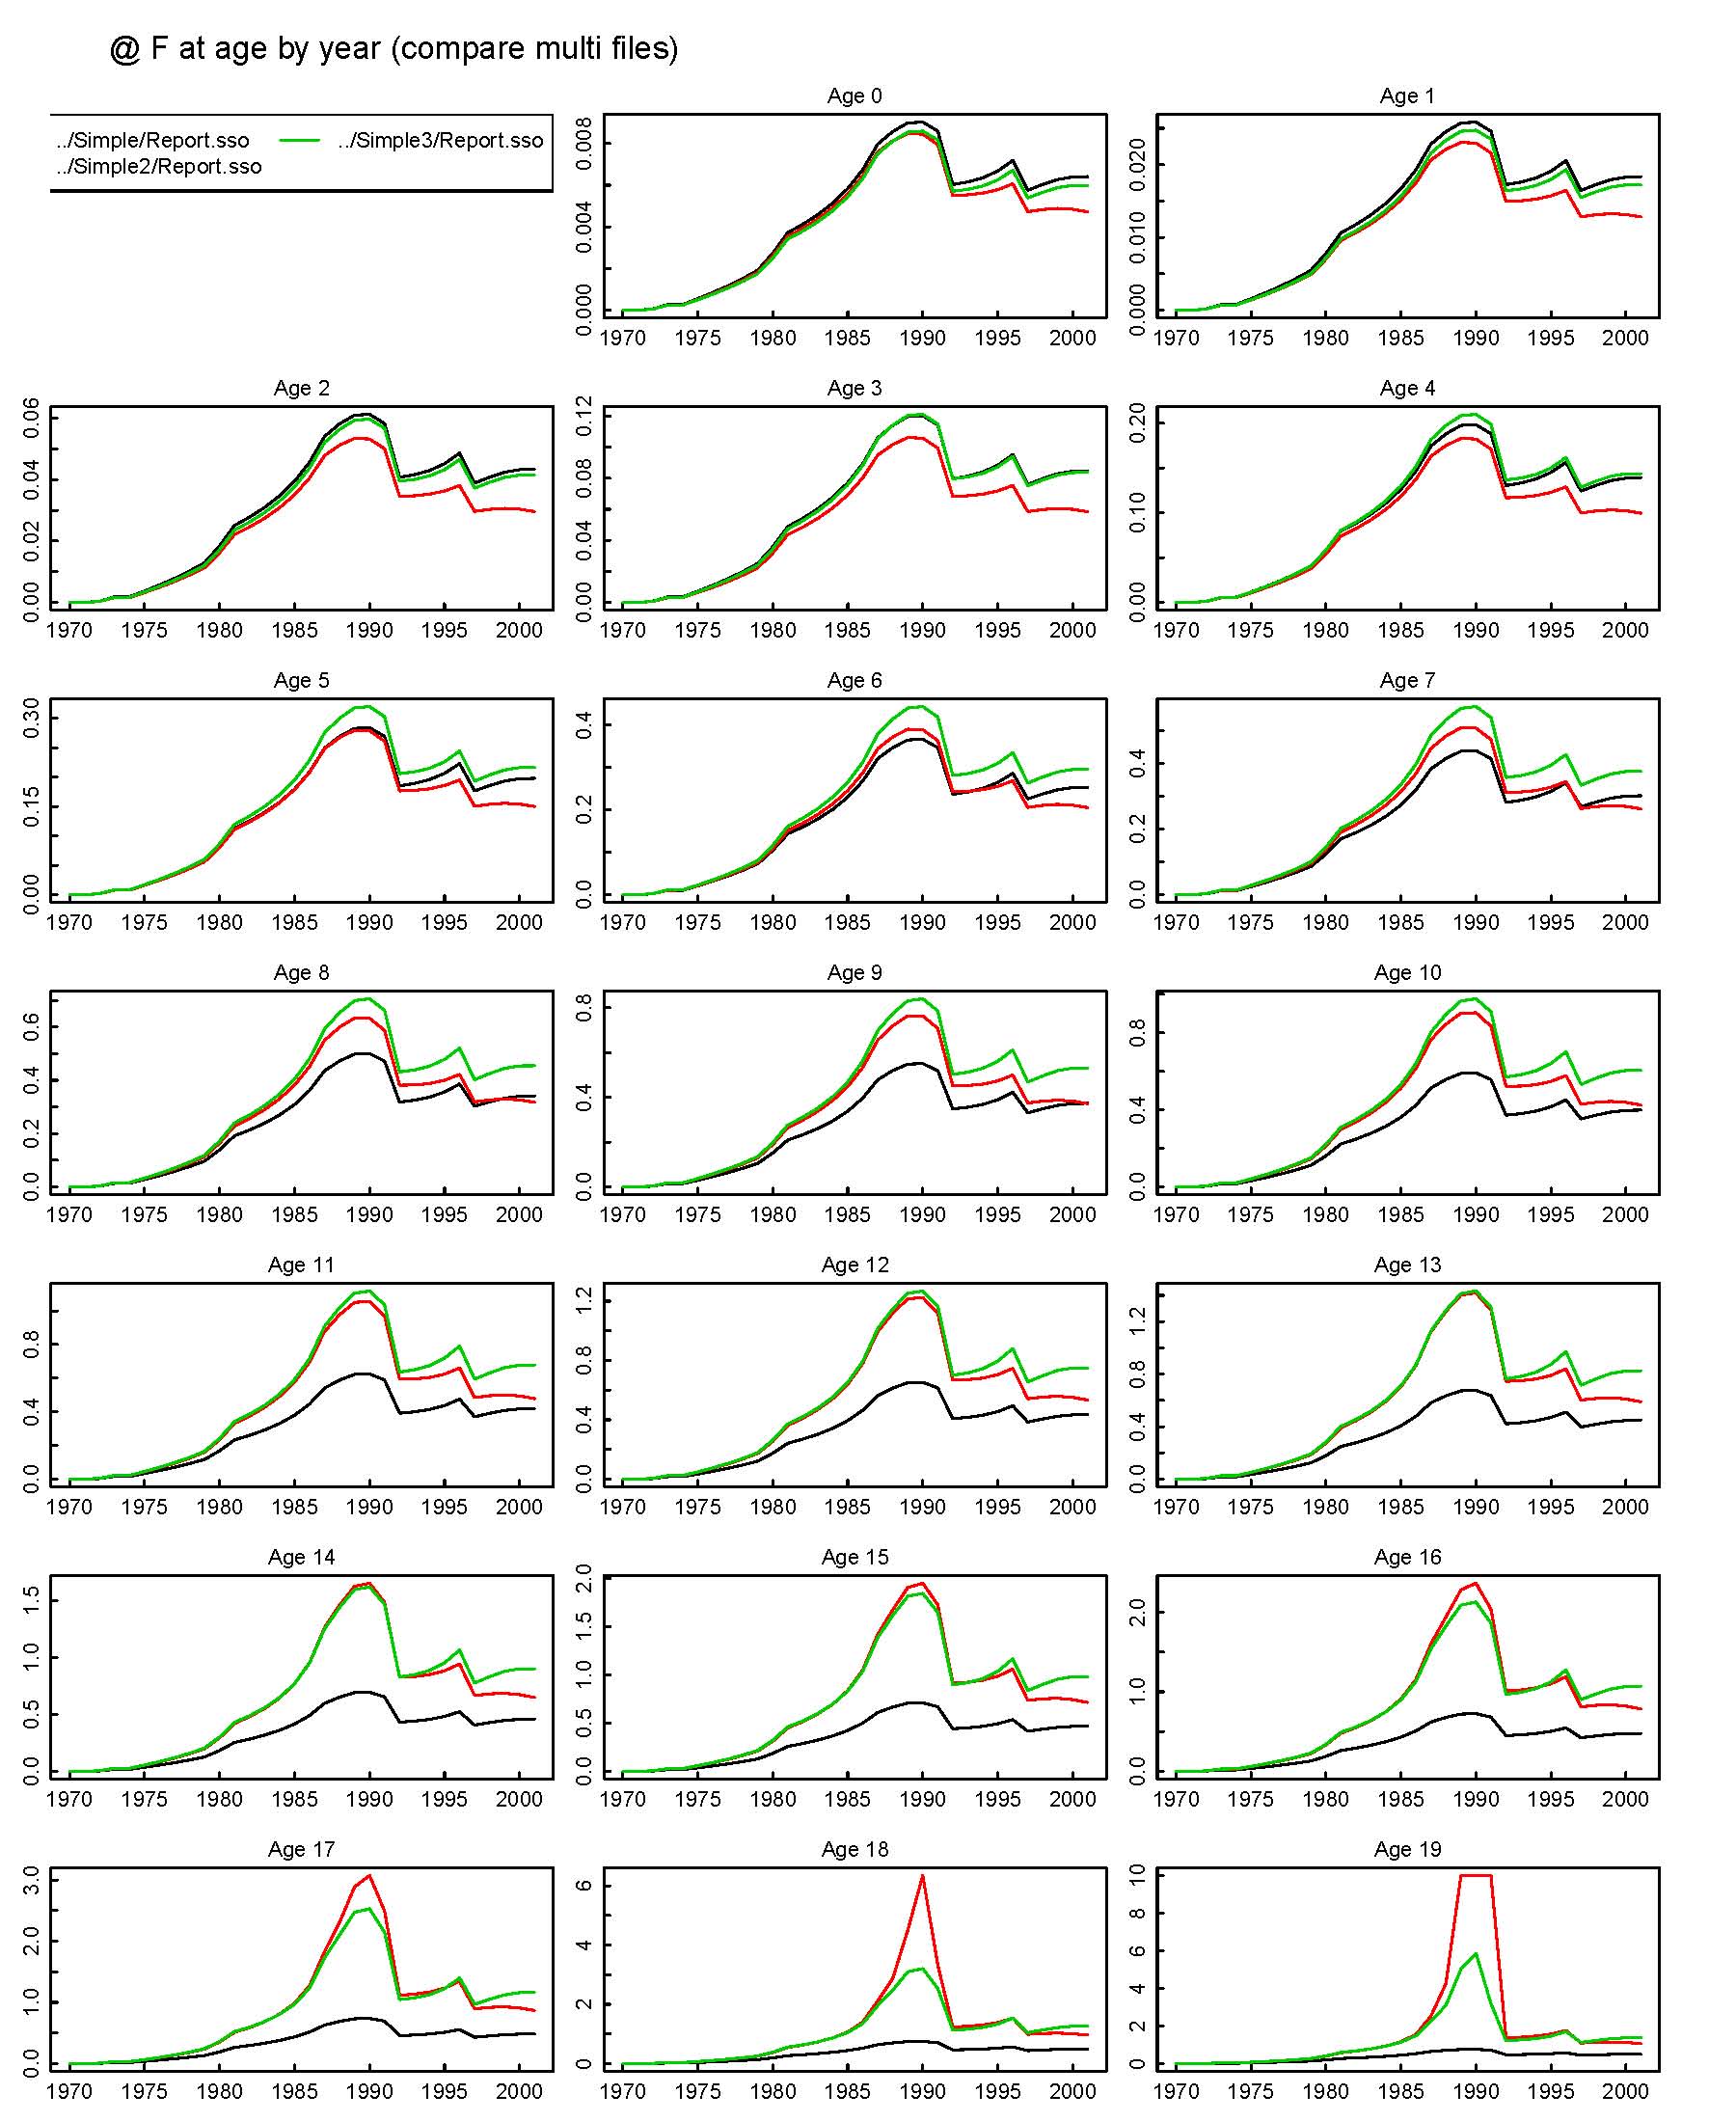
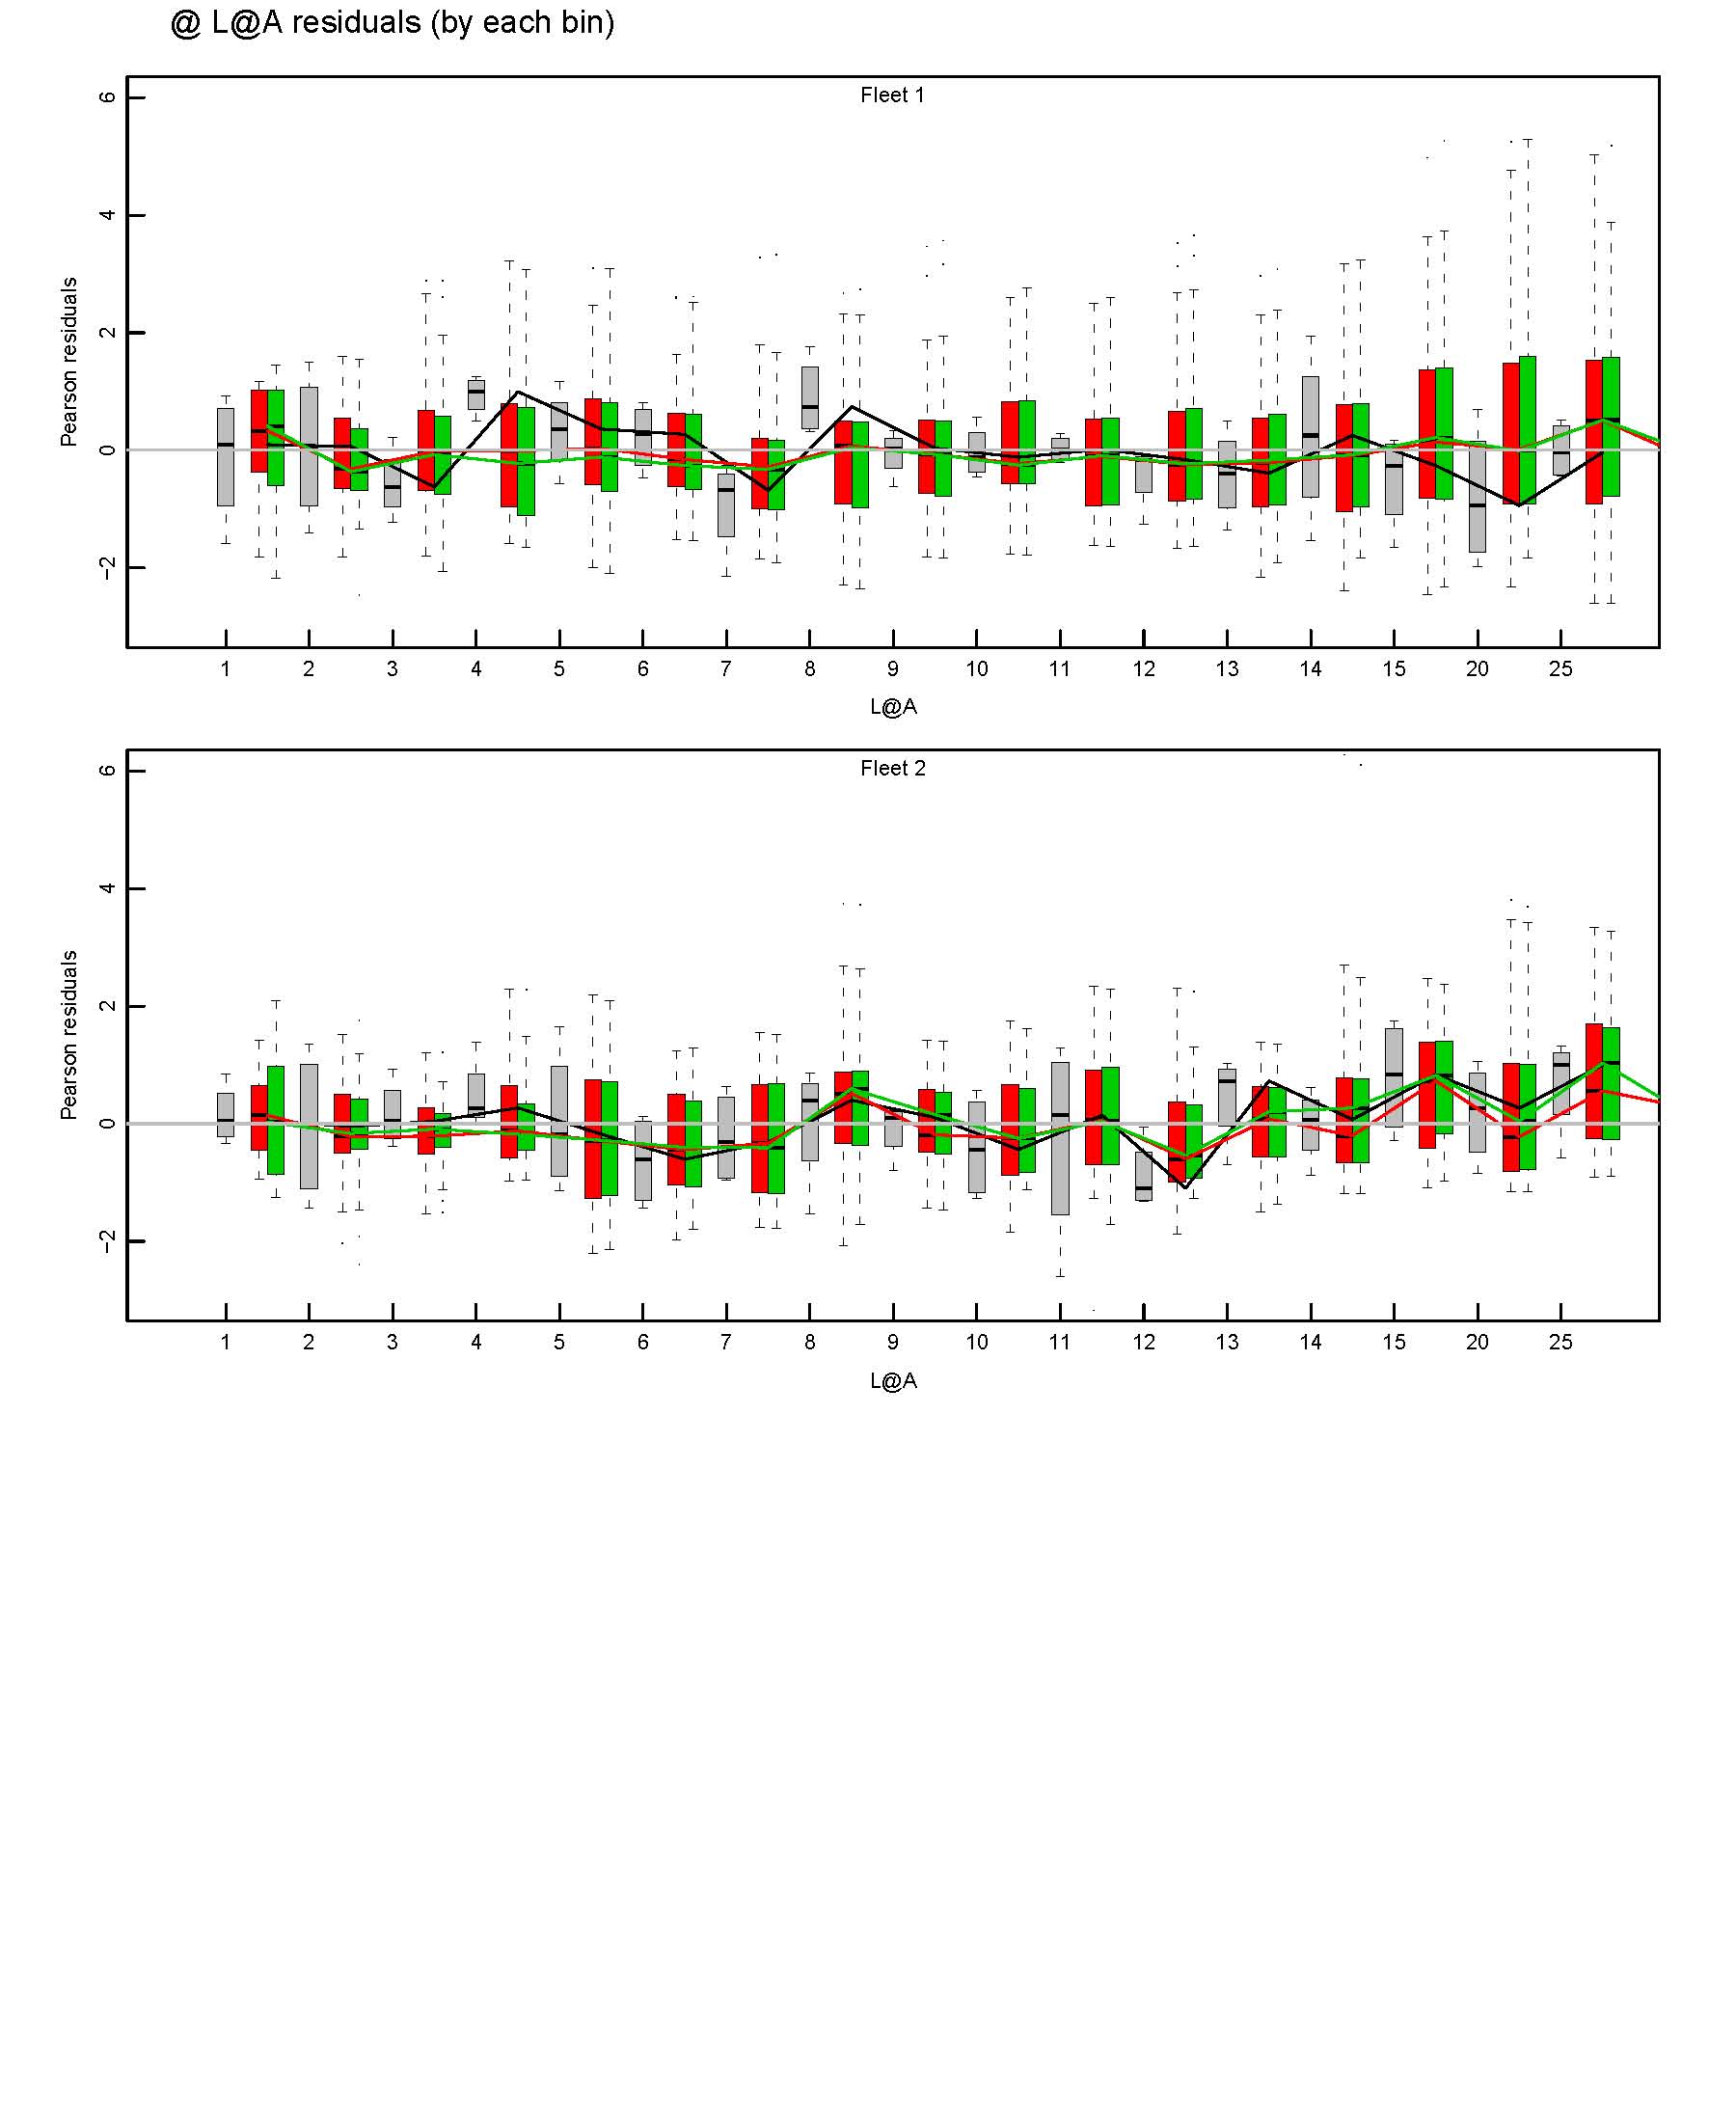
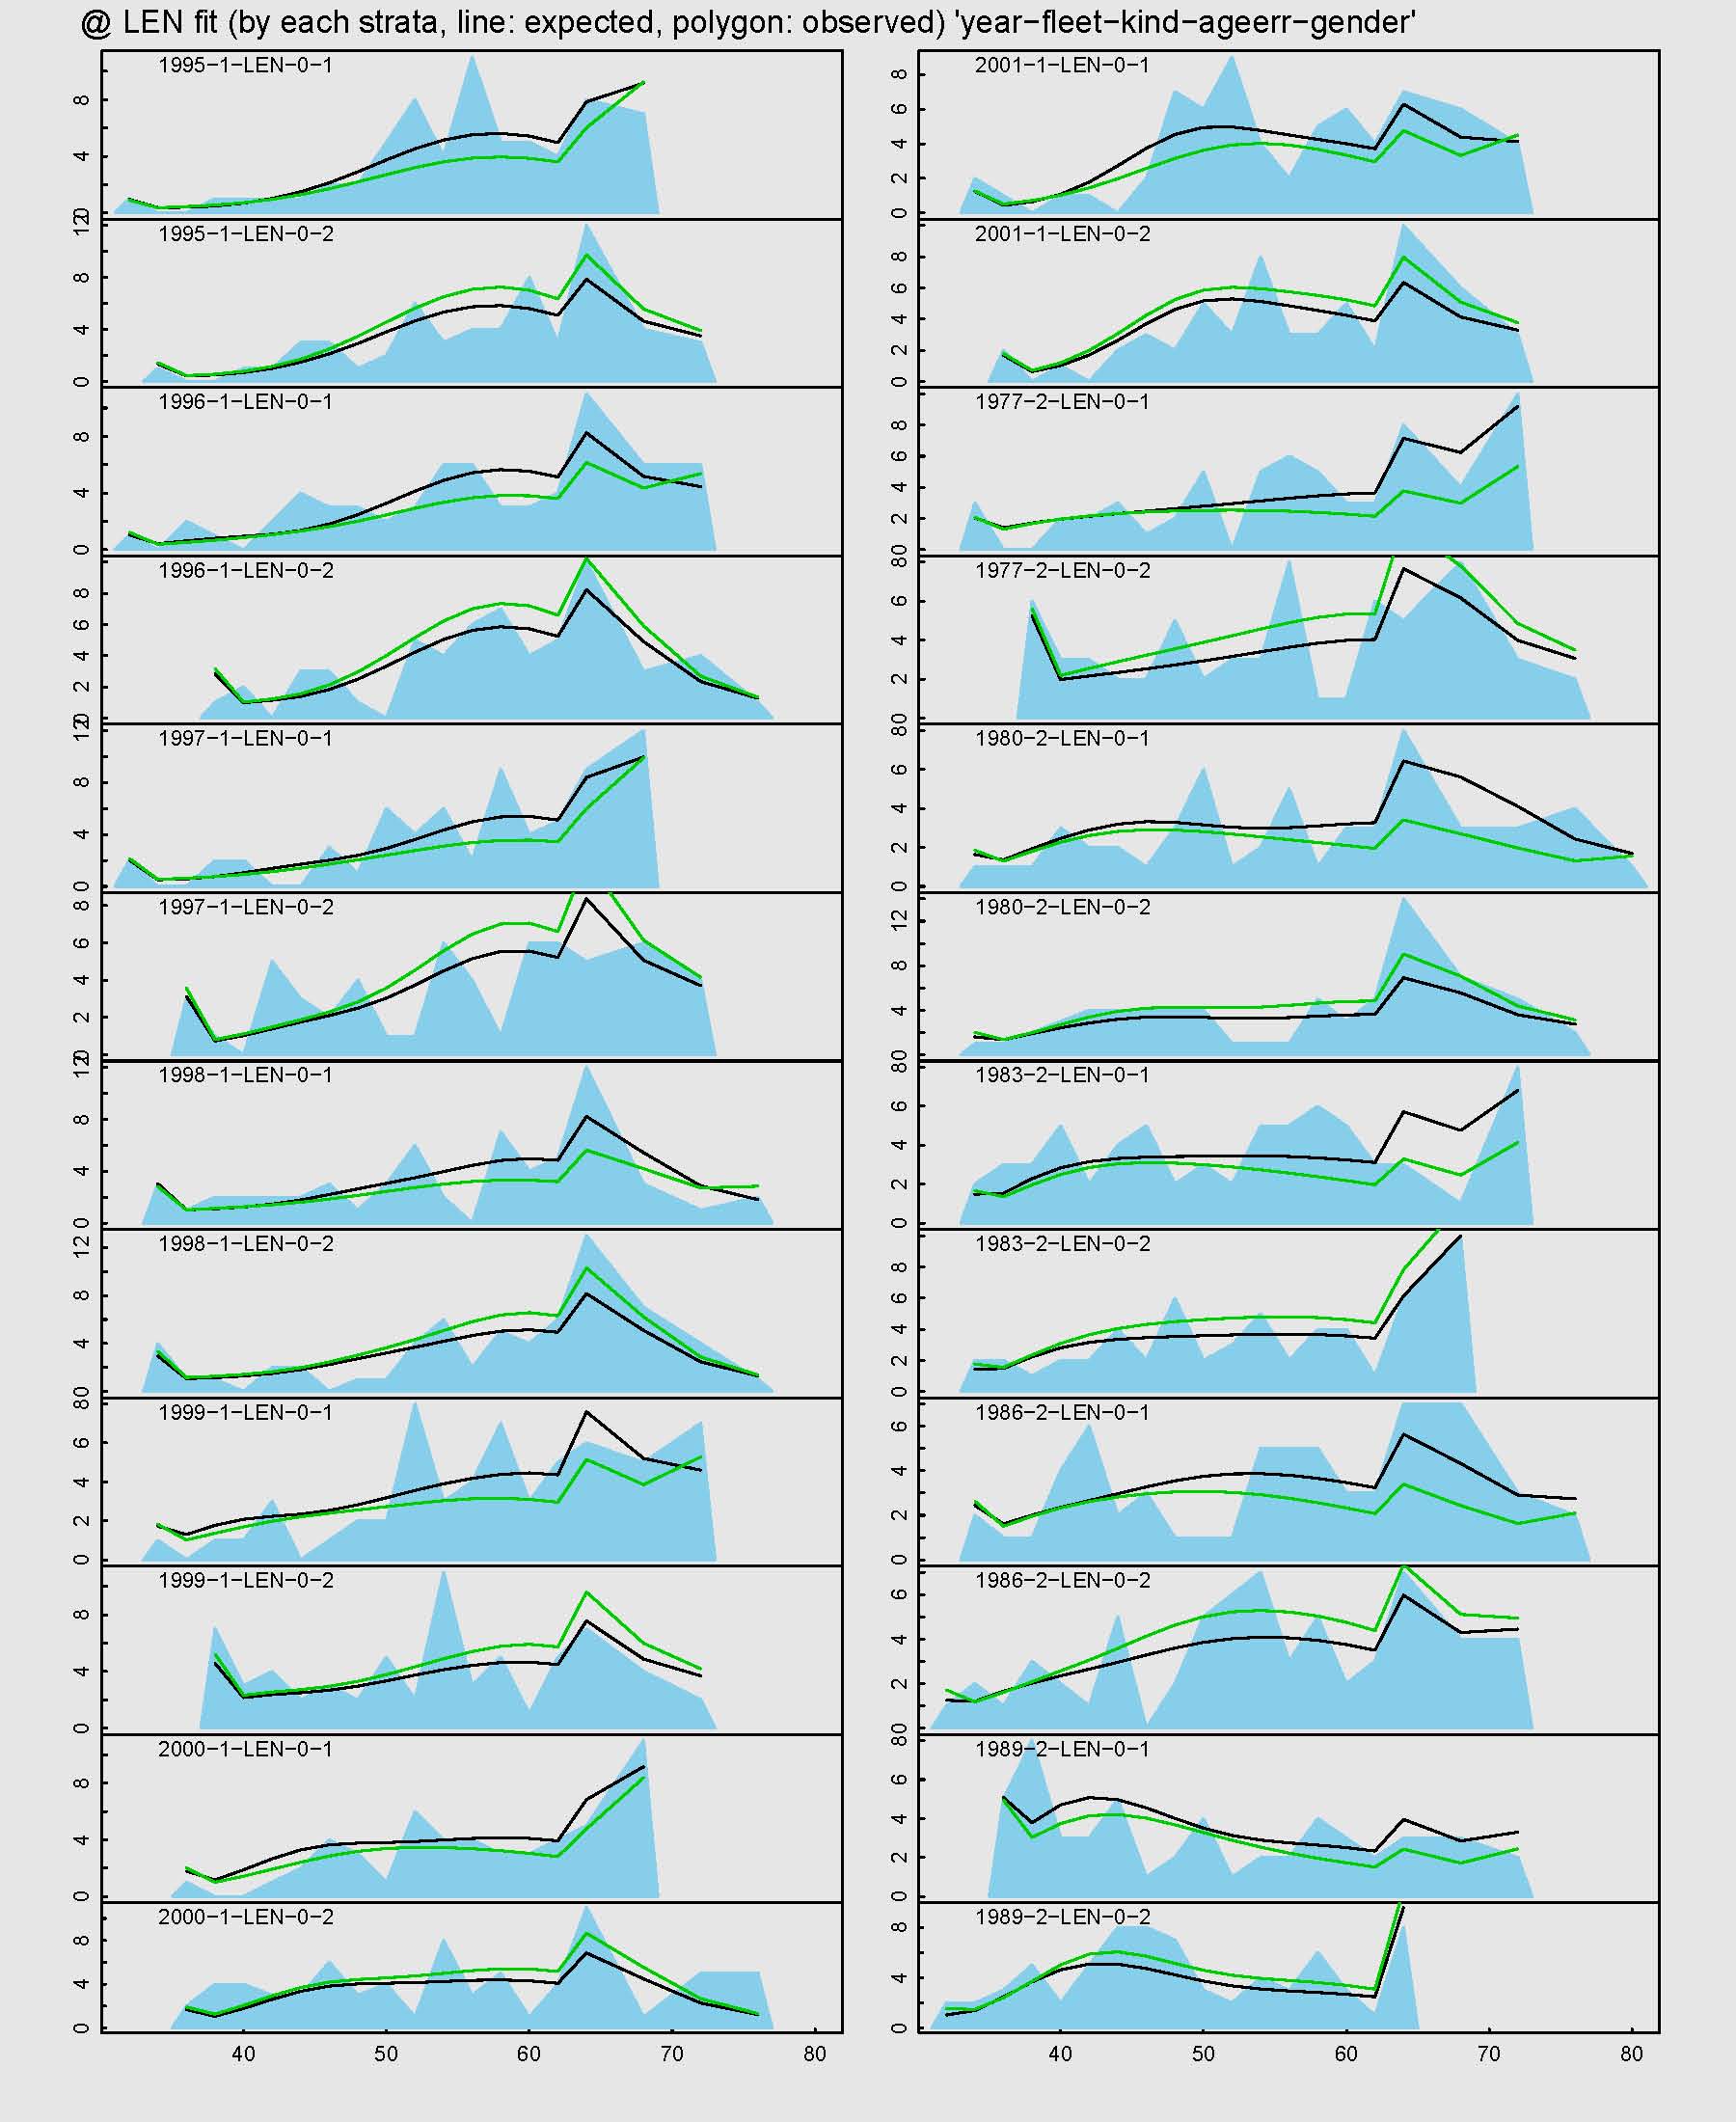
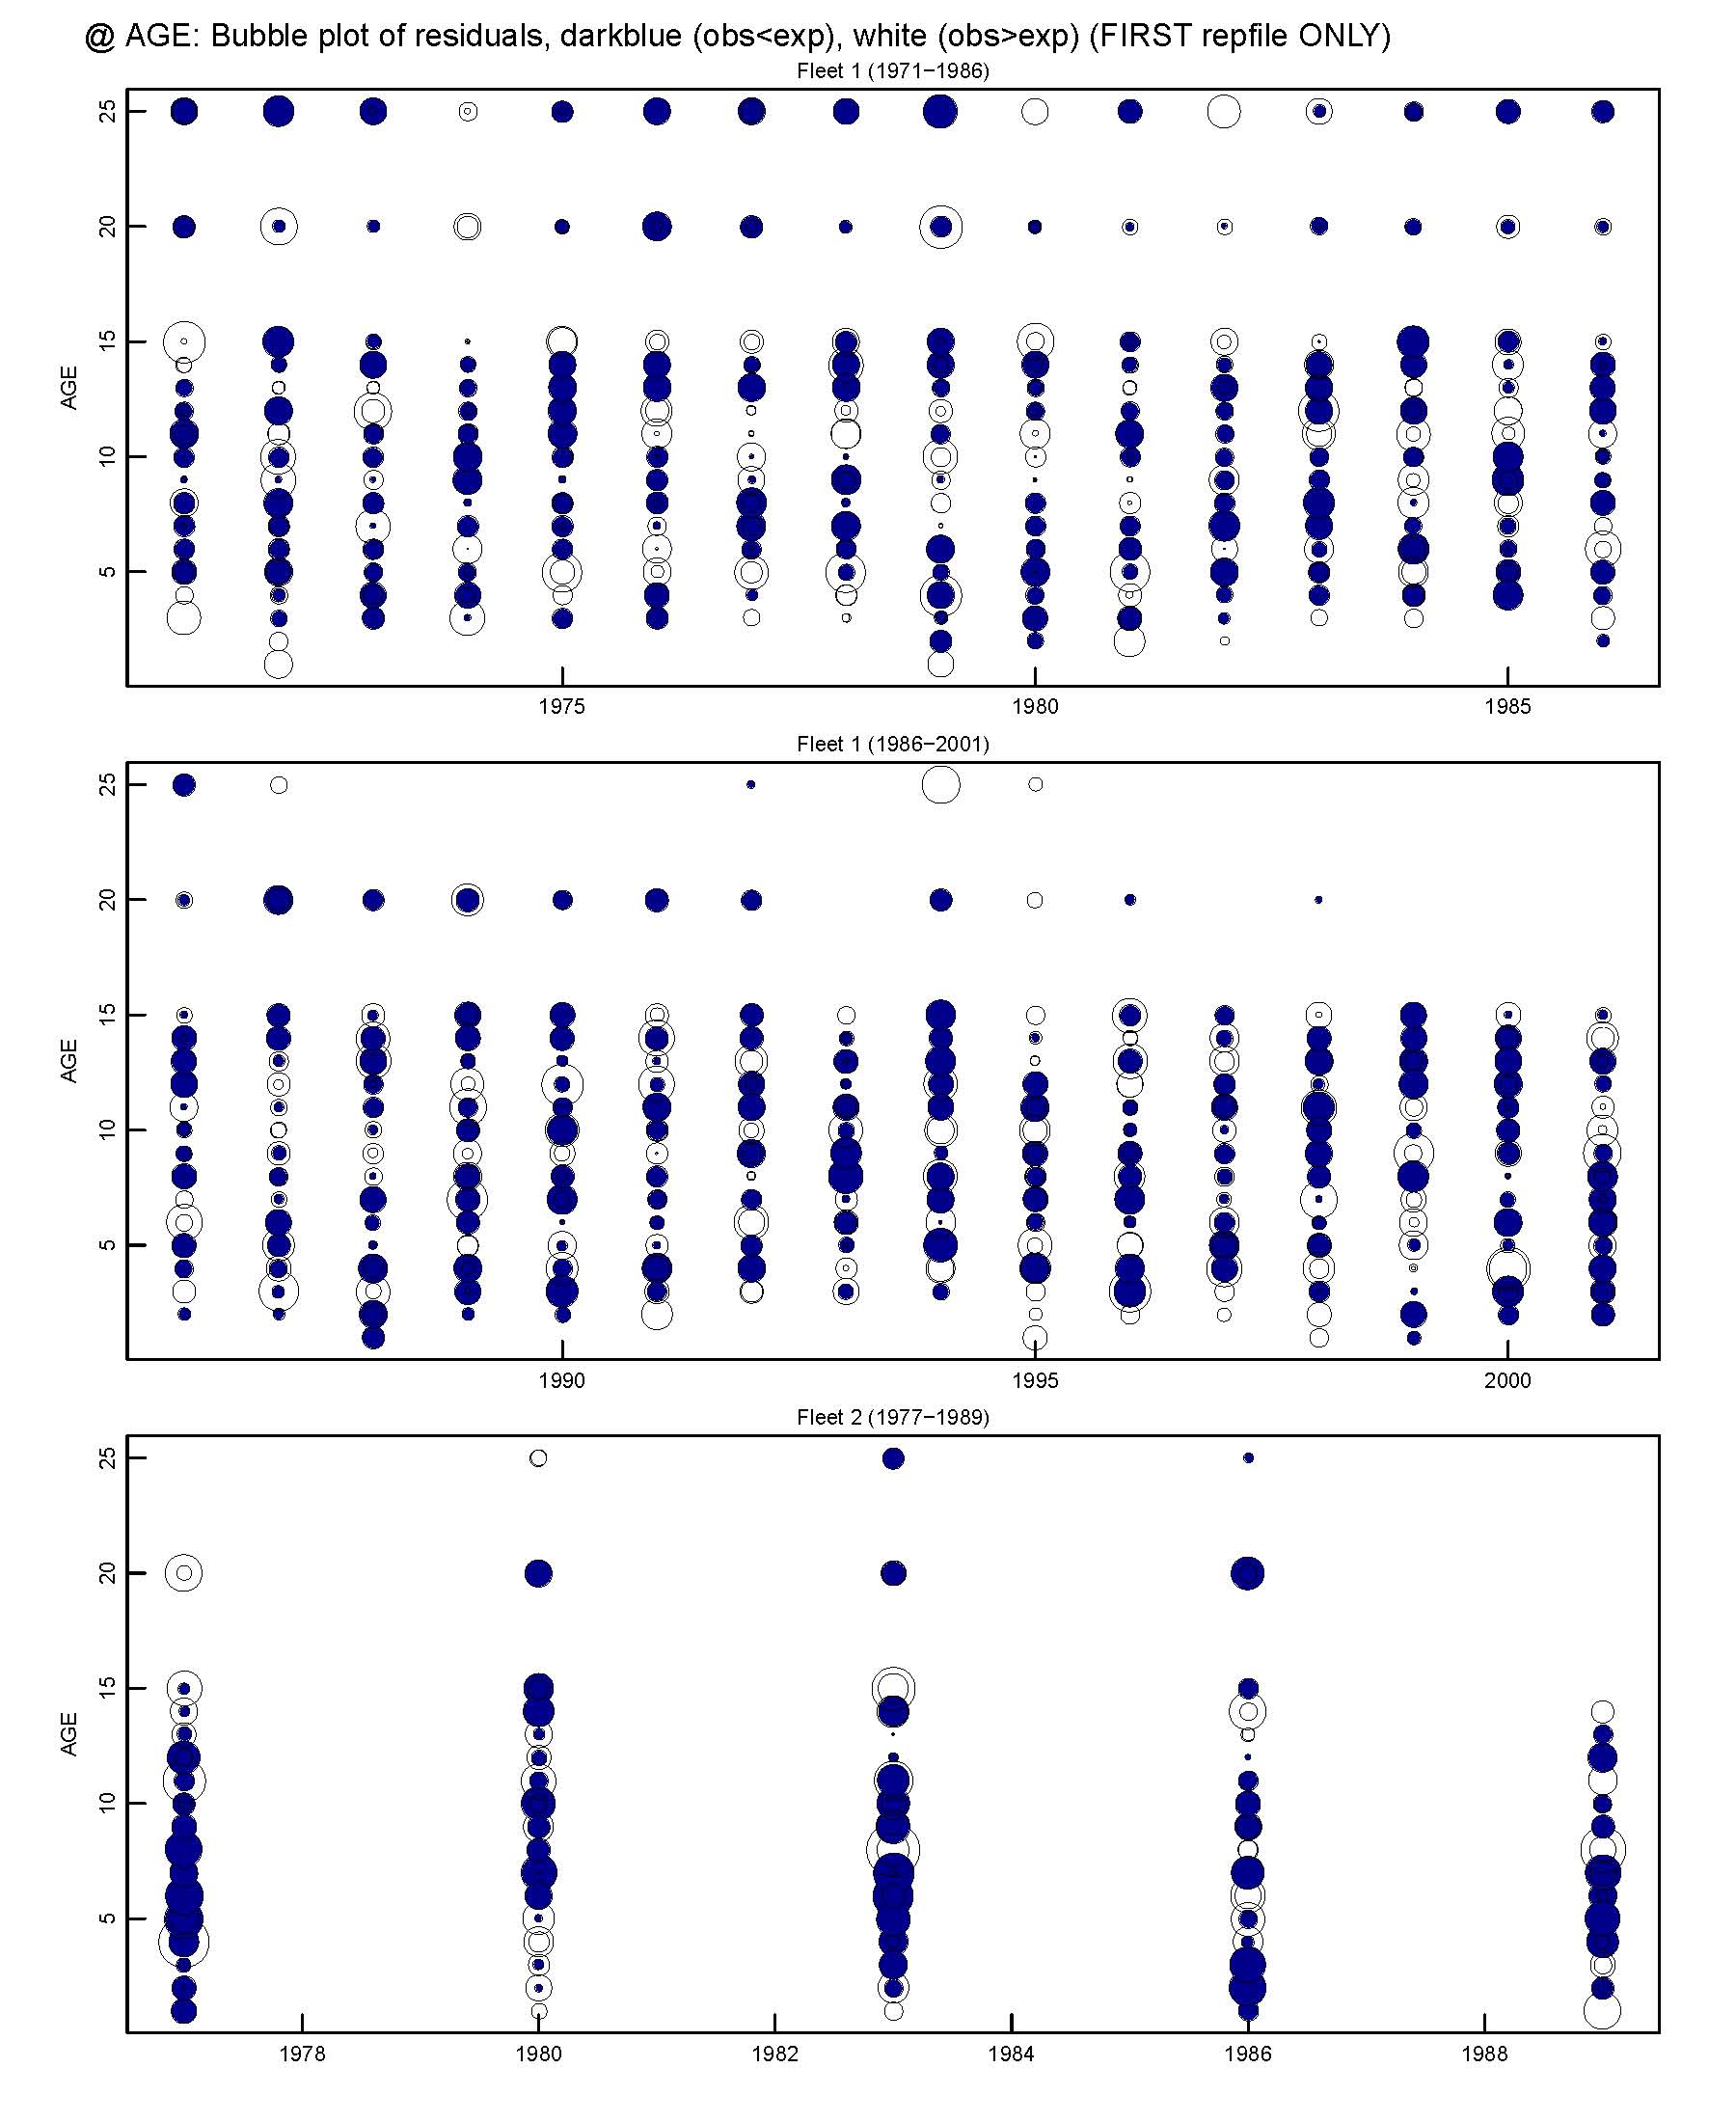
This packages is for producing diagnostics of results from Stock Synthesis (SS). While there is another packages, named r4ss, which is officially supported by developers of SS, this package of 'sstools' is specialized for over-plotting multiple results at once (see snapshots).
Change Log:
- 28 Nov 2013: 1.9 (add various minor improvement, and diagnostics to show effective sample size)
- 25 Oct 2012: 1.7 (Fix a bug when comparing multi CompReport.sso)
- 27 Sep 2012: 1.6 (Several changes)
- 30 April 2012: 1.5 (Fix bugs)
- 10 Jan 2012: 1.4 (For SS-3.23b)
- 19 Dec 2011: 1.3 (plot multiple growth curves when assuming multiple growth morphs, fix malfunction when calculating FAA in the base of multiple growth morph, developed under SS-3.21d)
- 8 Dec 2011: 1.2 (Fix the bug, when length-based maturity is used)
- 6 Dec 2011: 1.1 (Namespace is defined)
- 30 May 2011: 1.0.6 (Minor updates)
- 22 April 2011: 1.0.5 (change appearance and add length diagnostics)
- 12 April 2011: 1.0.4 (corresponding to SS3.2)
- 8 April 2011: 1.0.3 (minor update from 1.0.2)
- Some features are improved, but there are no large updates.
- 27th March 2011: 1.0.2 (minor update from 1.0.1)
- Largely reduce calculation time when over-plotting length fits with multiple repfiles.
- Make bubble plot bigger.
- Add a figure on F at age by years.
- 29th Dec 2010: Replace 1.0 with 1.0.1 (remove some bugs in 1.0)
- 17th Dec 2010: Add binary zip package for Windows XP
Download and Install:
[source code] sstools_1.9.tar.gz
- Install the 'tar.gz' ball from command line such as '> R CMD INSTALL sstools_X.X.X.tar.gz'
[For windows] sstools_1.9.zip (complied under windows XP (32bit))
- GO to menu -> package -> Install zip file in local directory -> Select the zip file
Usage: See help after calling the library of 'sstools' such as
library(sstools)
help(sstools)
Examples:
library(sstools)
# No options
allplot()

# overplots of multiple results
allplot(repfile=c("Report1.SSO","Report2.SSO","Report3.SSO"),
        compfiles=c("CompReport1.SSO","CompReport2.SSO","CompReport3.SSO"))
NOTEs when over-plotting multiple results:
- Only single bubble plot of length residuals is produced from the firstly specified repfile, even though multiple repfiles are specified. (複数のrepfileを指定しても、bubble plotの出力は、最初のrepfileのみ。)
- If overplotting results with different time period, please specify the repfile with longest time period for the first time. If not, the allplot can't work. (資源評価期間が異なる結果を重ね書きする場合は、一番長い時系列を一番最初に持ってくること。)
- It is difficult to overplot multiple repfiles with different 'defined fisheries', and 'future projection settings', where different number of selectivity curves are estimated in SS. (異なる漁業定義、将来予測の設定等を含むrepfileを一緒に重ね書きするのは困難(selectivityのプロットで止まる))
Past packages:
- sstools_1.6.tar.gz, sstools_1.7.zip: developed under SS-3.23b
- sstools_1.6.tar.gz, sstools_1.6.zip: developed under SS-3.23b
- sstools_1.5.tar.gz, sstools_1.5.zip: developed under SS-3.23b
- sstools_1.4.tar.gz, sstools_1.4.zip: developed under SS-3.23b
- sstools_1.3.tar.gz, sstools_1.3.zip: developed under SS-3.21d
- sstools_1.2.tar.gz, sstools_1.2.zip: developed under SS-3.10b
- sstools_1.1.tar.gz, sstools_1.1.zip: developed under SS-3.10b
- sstools_1.0.6.tar.gz, sstools_1.0.6.zip: developed under SS-3.10b
- sstools_1.0.5.tar.gz, sstools_1.0.5.zip: developed under SS-3.10b
- sstools_1.0.4.tar.gz, sstools_1.0.4.zip: developed under SS-3.10b
- sstools_1.0.3.tar.gz, sstools_1.0.3.zip: developed under SS-3.10b
- sstools_1.0.2.tar.gz, sstools_1.0.2.zip: developed under SS-3.10b
- sstools_1.0.1.tar.gz, sstools_1.0.1.zip: developed under SS-3.10b
Snapshots
** Original data of this snapshots are from 'simple' example in Stock Synthesis HP at NOAA
Back to the top page
